How does Super Typhoon Haiyan compare to Hurricane Katrina?
There has been a lot of talk about Super Typhoon Haiyan’s intensity, and rightfully so, as it was among the most intense storms in the world ever documented. Here in the U.S., one of the most notorious and memorable hurricanes in recent history was Katrina in 2005. Not only did it become a Category 5 hurricane in the central Gulf of Mexico, it continued on to make landfall as a Category 3 storm near the Louisiana-Mississippi border and created tragic and desperate scenes similar to what we’re seeing in the Philippines now.
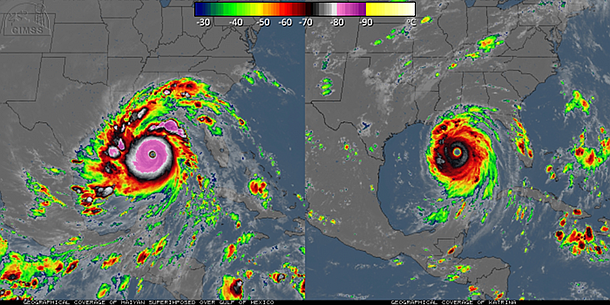
In this side-by-side comparison (below), Haiyan and Katrina are shown at peak intensity, and also shown at the same scale and overlaid on the same map. On an infrared satellite image, colder temperatures correspond to higher clouds, and higher clouds in a hurricane/typhoon means stronger thunderstorms underneath.
By any measure, Haiyan (left) was more intense than Katrina (right) at its peak. Both have clear eyes, but the ring of clouds over the eyewall is much colder and thicker in Haiyan.
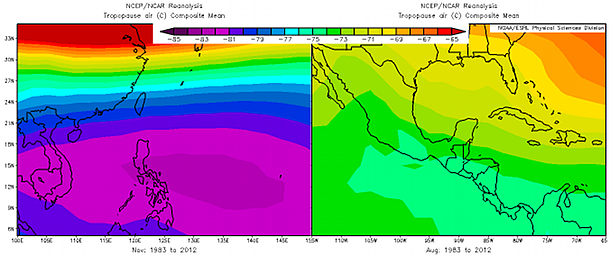
There is a very natural and known reason for these differences. While both storms were over very warm water – around 86F (30C), the tropopause (the top of the portion of the atmosphere where weather and clouds exist) is higher and colder in the western tropical Pacific than it is in the tropical Atlantic – giving storms a decided intensity advantage. In fact, if we compare the average November tropopause temperature in the West Pacific (corresponding to Haiyan) to the average August tropopause temperature in the Gulf of Mexico (corresponding to Katrina), we see that there’s about a 12C (22F) difference, which actually accounts for virtually all of the difference you see above.
Intensity estimation of tropical cyclones is a tricky business, especially when all you have is satellite images and no aircraft reconnaissance. We need to be careful not to assign more certainty to the intensity values than they merit. Calling Haiyan “among the most intense tropical cyclones ever” is correct, but to claim that it’s number one or three, or any absolute rank, is simply impossible.
First of all, there have not been a lot of these mega-storms in recorded history (less than 20). Secondly, it’s really challenging to get actual observations for storms outside the Atlantic, and third, techniques, observational methods, instruments have evolved over the years making a global fully consistent dataset extremely challenging to create (see IBTrACS for a leading effort).
In the “Best Track” database, each forecasting agency keeps records of 6-hourly position, intensity, pressure, size, etc for all tropical cyclones. Using the National Hurricane Center’s data on Katrina, at peak intensity the sustained winds were 150 knots (173 mph), the central pressure was 902 mb, and the average radius of hurricane-force winds was 80 nautical miles (92 statute miles). Using the Joint Typhoon Warning Center’s data on Haiyan at its peak, the sustained winds were 170kts (196 mph), the central pressure was 895 mb, and the average radius of hurricane-force winds was just 46 nautical miles (53 statute miles). The “business end” of Haiyan was quite a bit smaller than Katrina’s, but was likely stronger.
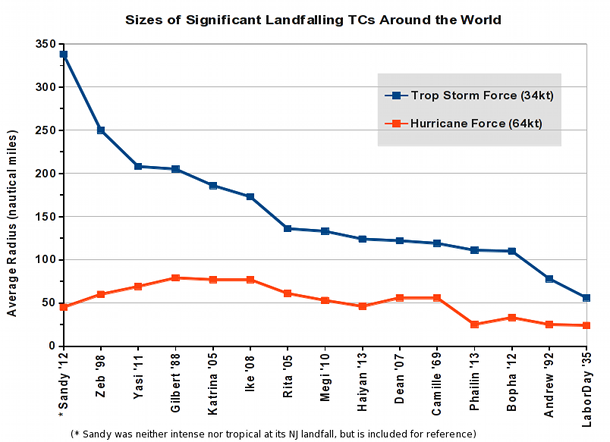
To put Haiyan’s size in perspective, here is a chart showing the sizes (average radii of tropical storm force winds and hurricane force winds) of various significant tropical cyclones at landfall from around the world. A couple of very important notes: 1) these are sizes at landfall, not necessarily at peak intensity, and 2) size data in the databases are known to be of limited reliability, so this is not a rigorous absolute ranking. (For storms in the West Pacific, South Pacific, and Indian basins, I used JTWC’s best track data. For storms in the Atlantic, I used H*Wind analyses when available, otherwise I used final tropical cyclone reports.)
So while Haiyan was extremely intense, it was relatively compact and was moving quickly… thankfully, these two factors helped to reduce the severity and the extent of the worst damage.